Test Programs
The purpose of this chapter is to define the “programming environment” of a test program in the CORE-V-VERIF verification environment. The current version of this document is specific to the CV32E40 family of CORE-V cores. Further versions will be sufficiently generic to encompass all CORE-V cores.
A “test program” is set of RISC-V machine instructions that are loaded into the testbench memory and executed by the core RTL model. Test-program source code is typically written in C or RISC-V assembler and is translated into machine code by the toolchain. Test programs can be either human or machine generated. In either case it needs to be compatible with the hardware environment supported by the core and its testbench. Programming for CORE-V-VERIF is the ultimate bare-metal coding experience as the environment supports the bare minimum of functionality required to verify the core.
Hardware Environment
For the purposes of this discussion, the “hardware environment” is a set of hardware resources that are visible to a program. In CORE-V-VERIF this is essentially the Core testbench comprised of the RTL model of the core itself, plus a memory model.
The core testbench for the CV32E40 cores has an instruction and data memory plus a set of memory mapped virtual peripherals. The address range for I&D memory is 0x0..0x10_0000 (1Mbyte). The virtual peripherals start at address 0x1000_0000.
The addresses and sizes of the I&D memory and virtual peripheral must be compatible with the Configuration inputs of the core (see Core Integration in the CV32E40P User Manual. The core will start fetching instructions from the address provided on its boot_addr_i input. In addition, if debug_req_i is asserted, execution jumps to dm_halt_addr_i. This hardware setup constrains the test-program in important ways:
The entire program, including data sections and exception tables must fit in a 4Mbyte space starting at address 0.
The first instruction of the program must be at the address defined by boot_addr_i (and obviously this address must exist).
The address dm_halt_addr_i must exist in the memory map, it should not be overwritten by the test program and the code there must produce a predictable result.
The program must have knowledge about the addressing and operation of the virtual peripherals (using the peripherals is optional).
Virtual Peripherals
The memory module in the Core testbench implements a set of virtual peripherals by responding to read or write cycles at specific addresses on the data bus. These virtual peripherals provide the features listed in Table 1.
Three virtual peripheral functions are in place to support RISC-V Compliance test-programs. These are a virtual printer that allows a test program to write to stdout, a set of status flags used to communicate end-of-sim and pass/fail status and a signature writer.
The debug control virtual peripheral can be used by a test program to control the debug_req signal going to the core. The assertion can be a pulse or a level change. The start delay and pulse duration is also controllable.
The use of the interrupt timer control and instruction memory stall controller are not well understood and it is possible that none of the testscases inherited from the RISC-V foundation or the PULP-Platform team use them. As such they are likely to be deprecated and their use by new test programs developed for CORE-V is strongly discouraged.
The CLINT Machine Timer and Sail Interrupt Generator were added to support
the RISC-V Architectural Certification Tests (ACT4).
ACT4’s machine-mode interrupt and timer certification tests require the
testbench to supply memory-mapped mtime/mtimecmp registers and a way
to assert and clear mip.MSIP and mip.MEIP.
These two peripherals (below) provide exactly that, mirroring the RISC-V Sail
reference model.
Virtual Peripheral |
VP Address (data_addr_i) |
Action on Write |
|---|---|---|
Address Range Check |
>= 2**20 |
Terminate simulation (unless address is one of the virtual peripherals, below). |
CLINT Machine Timer |
32’h0200_4000 |
MTIMECMP_LO: mtimecmp[31:0]. Resets to all-ones so MTIP stays low until a test arms it. Readable and writable. |
32’h0200_4004 |
MTIMECMP_HI: mtimecmp[63:32]. Readable and writable. |
|
32’h0200_BFF8 |
MTIME_LO: mtime[31:0]. Free-running 64-bit counter that increments every clock cycle; resets to 0 on reset. Readable and writable. |
|
32’h0200_BFFC |
MTIME_HI: mtime[63:32]. Readable and writable. MTIP (irq_o[7], mip.MTIP) is level-sensitive: asserted while mtime >= mtimecmp. Drives the core’s irq_timer_i pin. |
|
Virtual Printer |
32’h1000_0000 |
$write(“%c”, wdata[7:0]); |
Interrupt Timer Control |
32’h1500_0000 |
timer_irg_mask <= wdata; |
32’h1500_0004 |
timer_count <= wdata; This starts a timer that counts down each clk cycle. When timer hits 0, an interrupt (irq_o) is asserted. |
|
Debug Control |
32’h1500_0008 |
Asserts the debug_req signal to the core. debug_req can be a pulse or a level change, with a programable start delay and pulse duration as determined by the wdata fields: |
wdata[31] = debug_req signal value |
||
wdata[30] = debug request mode: 0= level, 1= pulse |
||
wdata[29] = debug pulse duration is random |
||
wdata[28:16] = debug pulse duration or pulse random max range |
||
wdata[15] = start delay is random |
||
wdata[14:0] = start delay or start random max rangee |
||
Sail Interrupt Generator |
32’h1500_0020 |
SIG Version (read-only). Reads return 32’h0001_0000 (version 1.0). Writes are ignored. |
32’h1500_0024 |
SIG Platform (write-only). Sets or clears the machine- mode interrupt lines asserted on irq_o:
Implemented bits: bit 3 (MSI, mip.MSIP), bit 11 (MEI, mip.MEIP). Reserved bits are ignored. State is level- sensitive and held until explicitly cleared. |
|
Random Number Generator |
32’h1500_1000 |
Reads return a random 32-bit value with generated by the simulator’s random number generator. Writes have no effect. |
Cycle Counter |
32’h1500_1004 |
Reads return the value of a free running clock cycle counter. Writes resets the cycle counter to 0. |
Instruction Memory Interface Stall Control |
32’h1600_XXXX |
Program a table that introduces “random” stalls on IMEM I/F. |
Virtual Peripheral Status Flags |
32’h2000_0000 |
Assert test_passed if wdata==’d123456789 Assert test_failed if wdata==’d1 Note: asserted for one clk cycle only. |
32’h2000_0004 |
Assert exit_valid; exit_value <= wdata; Note: asserted for one clk cycle only. |
|
Signature Writer |
32’h2000_0008 |
signature_start_address <= wdata; |
32’h2000_000C |
signature_end_address <= wdata; |
|
32’h2000_0010 |
Write contents of dp_ram from sig_start_addr to sig_end_addr to the signature file. Signature filename must be provided at run-time using a +signature=<sig_file> plusarg. Note: this will also asset exit_valid with exit_value <= 0. |
Table 1: List of Virtual Peripherals
Board Support Package
The role of the Board Support Package (BSP) is to align the test-programs with the hardware. There are a number of files that define the BSP. These are discussed below.
Illustration 9 uses the Core testbench as an example to illustrate the relationship between the testbench (everything inside the yellow rectangle), the test program (testcase.S) and a BSP (crt0.S and link.ld). The toolchain uses the BSP to align resources used by the test program with resources supported by the hardware. Note that the UVM verification environment will use the same test program environment as the Core testbench.
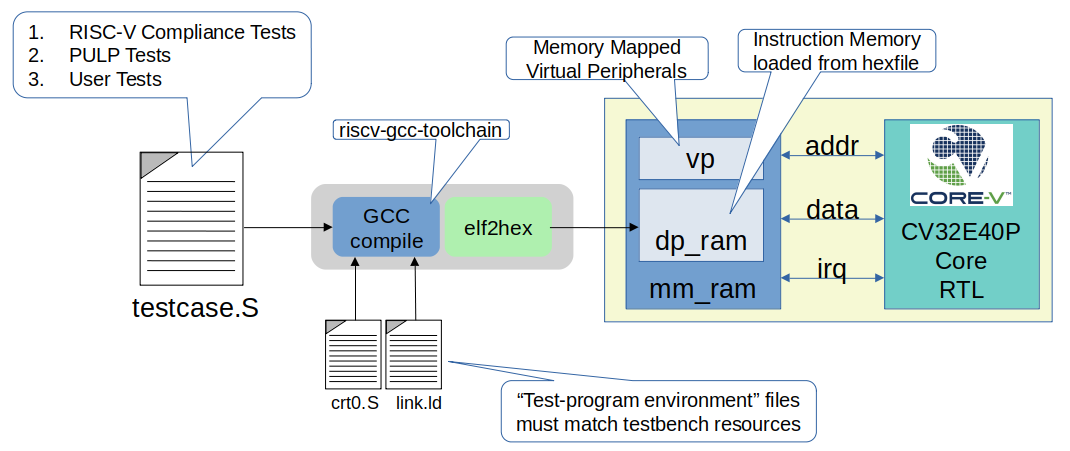
Illustration 9: Board Support Package for “Core” testbench
This linkage between the test-program and hardware needs to be flexible to support a variety of test-program sources:
manually written assembler and C test-programs inherited from RI5CY
test-programs from the RISC-V Foundation Compliance Test Suite
manually written OpenHW test-programs
machine generated test-programs from an instruction generator (e.g. riscv-dv)
Elements of the BSP
Most of our test-programs are written/generated in RISC-V assembler. A set of global symbols are used to define control points to a linker that will generate the machine-code in a memory image. Examples of these are .start, .vectors, .text, .data and .string. Here we will define a minimal set of symbols for use in CORE-V test-programs. A sub-set of these will be mandatory (e.g. .start), while others may be optional.
Linker Control File
A file variously refered to as the linker command file, linker control file or linker script and typically given the filename link.ld is used to map the symbols used in the test-program to physical memory addresses. Some excellent background material on the topic is available at Sourceware.org.
Typically, linker scripts have two commands, MEMORY and SECTIONS. If MEMORY is not present then the linker assumes that there is sufficient contiguous memory to hold the program.
Jeremy Bennett of Embecosm has provided a minimalist linker control file, and Paul Zavalney of Silicon Labs suggested additions to support the debugger. The two contributions have been merged into a single script by Mike Thompson:
OUTPUT_ARCH( "cv32e40p" )
ENTRY(_start)

MEMORY
{
   /* This matches the physical memory supported by the testbench    */
   mem (rwxai) : ORIGIN = 0x00000000, LENGTH = 0x00100000

   /* ORIGIN must match the dm_haltaddr_i input to the core RTL */
   dbg (rwxai) : ORIGIN = 0x1A110800, LENGTH = 0x800
}

SECTIONS
{
   DBG :
   {
      .debugger (ORIGIN(dbg)):
      {
        KEEP(*(.debugger));
      }

      /* Debugger Stack*/
      .debugger_stack         : ALIGN(16)
      {
       PROVIDE(__debugger_stack_start = .);
       . = 0x80;                    /* Is this ORIGIN + 0x80? */
      }
   } >dbg

   MEM :
   {
      . = 0x00000000;
      .vectors : { *(.vectors) }
      . = 0x00000080;                   /* must equal value on boot_addr_i */
      _start = .;
      .text : { *(.start) }
      . = ALIGN (0x80)
      .legacy_irq : { *(.legacy_irq) }  /* is this still needed? */
      . = ALIGN(0x1000);
      .tohost : { *(.tohost) }
      . = ALIGN(0x1000);
      .page_table : { *(.page_table) }
      .data : { *(.data) }
      .user_stack : { *(.user_stack) }
      .kernel_data : { *(.kernel_data) }
      .kernel_stack : { *(.kernel_stack) }
      .bss : { *(.bss) }
      _end = .;
   } > mem
}
C Runtime
While it is assumed that the vast majority of test programs written for CORE-V pre-silicon verification will be captured as assembly (*.S) programs, the environment provides support for minimalist C programs via a C runtime file in ./cv32e40p/bsp/crt0.S. crt0.S performs the bare minimum required to run a C program. Note that support for command-line arguments is deliberately not supported.
Additional Information
Additional information on the Board Support Package can be found in its associated README in the core-v-verif GitHub repository.
Debug Mode Support
The BSP allocates a region of memory for debug instructions. Its important to note that this debug memory is not a separate memory in the testbench; it is merely a specific region of the memory. The debug memory is loaded with a hex image defined with the plusarg +debugger=<filename.hex>.
It is a requirement that the hardware configuration of the debug memory and the start of the debug region as defined in the BSP be aligned. Using the CV32E40P as an example, asserting the debug_req_i will cause it to enter debug mode and start executing code located at dm_halt_addr_i. The debug origin in the BSP must match the dm_haltaddr_i configuration input to the core RTL.
If the +debugger plusarg is not provided, then the debug memory will have a single default instruction, dret, that will result in the core returning back to main execution of the test program. The debug_test is an example of a test program that will use the debug control virtual peripheral and provide a specific debugger code image.
Interrupt Support
TBD